


Should Your Online Shop Be a D2C (Direct-to-Consumer) Brand?
The Direct-to-Consumer strategy has become very popular in recent years. Should your business become a D2C brand? Learn more in our blog article.
KPIs and e-commerce simply belong together. In the world of online shopping, we have the ability to observe the digital behaviour of consumers, which can give us incredible insights. These insights can tell you what you’re doing right and what you’re doing wrong if you know what to look for and how to analyse them. Today, we’re going to look at some of the most important KPIs in e-commerce and see what stories they tell and how you can use this information to optimise your online business.
With an eye towards optimisation, we’ll break down some of the top e-commerce KPIs and metrics into different categories for your business:
Table of Contents
When we think about e-commerce KPIs and metrics, it all really starts and ends with conversions, doesn’t it? In the digital world, “conversions” can mean a lot of different things.
Of course, as an online shop owner, you’re probably thinking about sales. If your online shop has been around for a while and you’ve been seeing a decent amount of traffic, then your biggest concern is probably being able to convert more visitors into shoppers.
However, depending on your business, you can actually look at conversions to mean a few different things.
First thing’s first: Let’s define how to calculate a general conversion rate:
Conversion rate (%) = (number of visitors executing a defined action /
number of all website visitors) (*100)
As you can see, the equation for a conversion rate is quite simple. Essentially, you’re figuring out how many of your site/page’s visitors accomplished a specific goal.
As we mentioned, in many cases, you’ll define this specific goal as purchasing a product. This would generally be considered your sales conversion rate, but it could be other things as well. You could use a variation of this equation to measure the success of your social media campaigns. This could apply to email campaigns as well and many other things.
Let’s look at a few examples, starting with your sales conversion rate:
Your sales conversion rate will simply look at how many of your site’s total visitors actually completed a purchase. There is no real standard or benchmark for what defines a “good” sales conversion rate. This depends entirely on your brand, your price range, your industry, and other factors.
Sales conversion rate (%) = (number of sales / total visitors) (*100)
To define what a good sales conversion rate is, you’ll need to take a look at your business and determine what your costs are, what your profits are and other factors. These definitions will have to be yours to make. One thing is definitely true: you can always optimise your conversion rates.
One thing to keep in mind is that your sales conversion rate only tells part of the story. Since completing a sale is only part of the equation, you’ll have to consider the other half of the equation for more context.

Shutterstock/NicoElNino
In this case, the other half of the equation is the total number of visitors on your site. The important thing here is that the traffic of your website is a whole other element to your business. Knowing how and why people end up on your website will give you extra context for why your numbers look the way they do.
Not all visitors to your website will be potential customers, and that’s very important to remember. That’s why a bit of SEO and traffic analysis is always important to look at. What keywords are leading to traffic on your site, and which pages do they end up on?
If you have a content strategy (e.g. a blog), there’s a good chance you’re bringing traffic to your website through pages that may not be intended to lead to direct sales. That’s not to say that content marketing and this kind of traffic are wasteful (there are a lot of benefits to a content strategy). It just means that you should consider such things whenever you look at these numbers.
Measuring the success of a lead campaign is another way to see how successful you are at conversions. For clarity, we’re talking about getting data from a potential customer. This could very well be used for social media campaigns or other efforts to drive engagement and/or traffic to your website.
Lead conversion rate (%) = (number of leads (for example newsletter subscriptions) / total visitors) (*100)
Let’s take newsletter subscriptions as an example. Imagine your business works in a very particular niche. If you create content from time to time and hold special sales during special times of year, having a newsletter go out to your audience can be extremely beneficial to your company’s goals.
Recommended reading:
9 Tips for Newsletters & Email Marketing in E-commerce
Customer retention is another element of your business that should be of particular interest to you when it comes to e-commerce KPIs, metrics, and eventually optimisation. It’s also an element that has plenty of insights if you know what to look for and analyse.

Shutterstock/Andrii Yalanskyi
Being able to turn first-time customers into repeat customers can do a great deal for your business. After all, you’ve probably heard that customer acquisition can cost 5x more than customer retention. Previous customers are also easier to convince to make a purchase than someone who’s never purchased from you before. That’s also why repeat customers’ average order values are higher than those of new customers.
Knowing how many of your customers are repeat customers is a good first step in getting an overview of your customer retention performance.
Repeat Purchase Rate (%) = ((Total customers with >1 purchase) / (Total purchasers)) (*100)
Once you have this number figured out, you can set goals regarding where you want that number to be in 6-12 months’ time.

Calculating the purchase frequency gives us insights into the average number of times a customer makes a purchase within a certain period of time.
Purchase frequency = (Total number of orders) / (Total number of unique customers)
How can you affect these numbers? Email campaigns can be a good start. If you have a segmented email list, you could create a workflow that reaches out to customers who haven’t completed a purchase in a while. You could, for example, motivate them by offering them a limited-time coupon.
Getting an overview of the “quality” of your customers is also a good step towards optimising your online shop. Customer quality metrics are an important part of e-commerce KPIs.
When we refer to the quality of the customer, we’re talking about how much they spend and how long they are a customer.
The average order value is pretty much exactly what it sounds like. How much does the average customer spend in your shop per order?
AOV = (Total value of products ordered) / (Total Orders)
Knowing this can help you plan out your budgets per year while also factoring in expected growth.
Improving your average order value could come down to improving your product line (read your product reviews) as well as implementing an upselling and/or cross-selling strategy.
The lifetime value (LTV) of your customers refers to the total amount spent on your website by a customer for a pre-defined period of time.
LTV = (AOV) * (Frequency of Purchase) * (Total active purchase years)
In this formula, the Total active purchase years are the number of years you expect to keep getting repetitive business from your customer.
For example, a standard e-commerce company could calculate an LTV based on 3 years of continuous activity of a customer. A company that sells specialised drills could estimate that the customer will need new drill bits every 2 years and hence could choose to calculate the LTV based on the number of purchases made by a customer over a span of 10 years.

Shutterstock/Proxima Studio
As a business owner, you can decide on what the best time span is to calculate your LTV.
LTV can be very useful while you are deciding to invest in marketing activities for your e-commerce business. By knowing the LTV of a customer, the total traffic and your conversion rate, you could very easily calculate how much advertising budget you can spend on every new customer.
Getting an overview of your company’s brand awareness can give you great insights into how you can improve it.
This is a pretty simple metric to acquire. If you’re somewhat familiar with Google Analytics or if you have an e-commerce platform that gathers this data for you, you should be able to get a quick overview of how much direct traffic you’re receiving.
To be clear, direct traffic refers to the number of website visitors you receive who are manually entering your website into their browsers (bookmarked pages count as well). In essence, direct traffic doesn’t refer to people who find you through search engines, but rather by knowing your website address and entering your site directly.
It's worth noting that Google defines this direct traffic as the traffic that has arrived on your website with no source or data. It is essentially assumed that the user has not clicked on a link to arrive on your website, but has entered the URL themselves in one way or another.
Whether it’s the keyword planner tool or another SEO tool that gives you insights into search volumes for specific keywords, you’ll want to investigate how much people are searching for your specific brand in Google. This will give you insights into how well-known your brand is.
When it comes to improving brand awareness in general, you can think about marketing promotions. Remember, Google and other social media apps often offer different campaign types depending on what your goals are.

Shutterstock/Monster Ztudio
It may seem counterintuitive, but not every dollar spent on marketing needs to bring in a sale. Sometimes, a brand campaign can do a lot for your business. Brand campaigns are often priced according to impressions rather than clicks. In other words, you are charged for how many people see your ad rather than how many people click on it.
Alternatively, if you do content marketing, you might want to consider reaching out to other popular brands and do some kind of content partnership, which could be something as simple as writing a guest blog. This will not only boost your SEO by having backlinks to your website on another site, but it may very well boost brand awareness for your company.
One of the best parts about online shopping (from the shopper’s perspective) is the ability to research online at your own pace. E-commerce might be the future, but it’s been around for quite a while. There are lots of sources online to research any product you want to buy and any company you are thinking of buying from. That is why analysing your customer satisfaction metrics is important.

If you don’t already collect product reviews, you really should! This is particularly true if other shops sell the same products as you.
You also never want to give your site’s visitors a reason to leave your shop. Not providing authentic product reviews directly on your product pages is one big reason someone might leave your shop. They might look elsewhere for the reviews and plan to buy from you, but why even have them visit another website or retailer? Keep them on your page by offering product reviews right on your site!
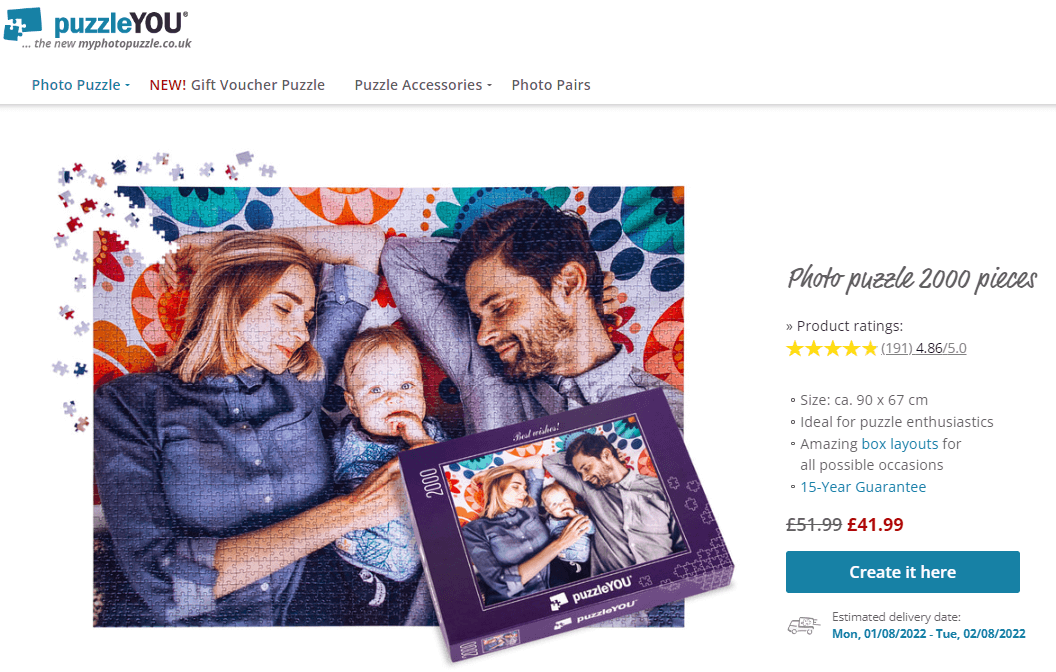
The product rating is available at the top of the product page
(Source: PuzzleYou)
Besides helping with conversions, product reviews can give you insights into the quality of your products (who would’ve thought?). After all, product reviews are more than just a conversion tool. They can really help you improve your product offering. If a certain product doesn’t get good reviews, it might be time to consider removing it from your website altogether.

Similar to product reviews, service reviews can be a conversion booster as well. If you advertise on Google Shopping, for example, service reviews can help your shop stand out from the other sellers. If you run Google text ads, you can also display your service ratings (in the form of stars) directly in your ads.
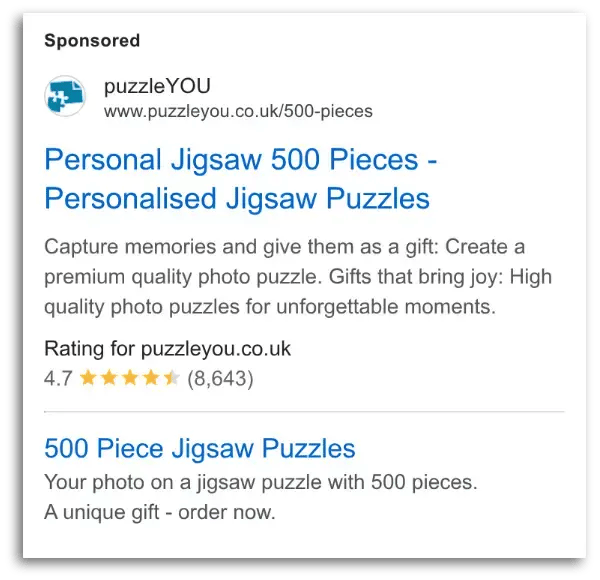
Service reviews can be placed in Google Ads to attract attention.
(Source: PuzzleYou)
Once again, these customer reviews are more than just a conversion tool. They provide great insights into what your company is doing right (or wrong). If your customer service team doesn’t keep your clientele happy, you’re going to lose out on some customers – and that’s a fact.
It's worth noting that even if you don’t actively collect service reviews for your shop, other companies might! Consider reputation management to drive customers to write you more reviews and improve your ratings on those various sites.

Recommended reading:
How to Collect More Online Customer Reviews and Boost Your Business
NPS (Net Promoter Score) is another concept similar to customer reviews. Essentially, your NPS score should measure the extent to which your customers would recommend your company to others based on the customer service your business provides.
Shoppers are divided into three categories:
Essentially you subtract the percentage of shoppers who are “detractors” from the percentage of your shoppers who are promoters to get your NPS.
NPS = Promoters % - Detractors %
A big part of improving your overall online reputation comes down to your customer service as well as being open, honest, and transparent with your unhappy clients. Respond to your negative reviews if you can. This may lead to some reviewers retracting or updating their negative reviews. However, even if they don’t do that, other customers will see that you’ve responded and this will have a positive boost on the perception of your brand.
As important as it is to reply to reviews, it's definitely a time-consuming task. That's why Trusted Shops has created an A.I.-powered tool that creates unique and relevant replies for your business with the click of a button. Learn more by clicking on the banner below:

One of the biggest advantages of owning an e-commerce business is the ability to analyse consumer behaviour on your website accurately. Make sure you look at the right actions on your website and analyse what is and isn’t working. With the right metrics and analytics, optimisation is always possible!
26/07/22